 mandacode
Meerkat: Changing the Paradigm of Log Analysis with AI Agents
The design philosophy and implementation of Meerkat, where AI Agents directly analyze infrastructure beyond the limitations of rule-based alerts
Problem Awareness
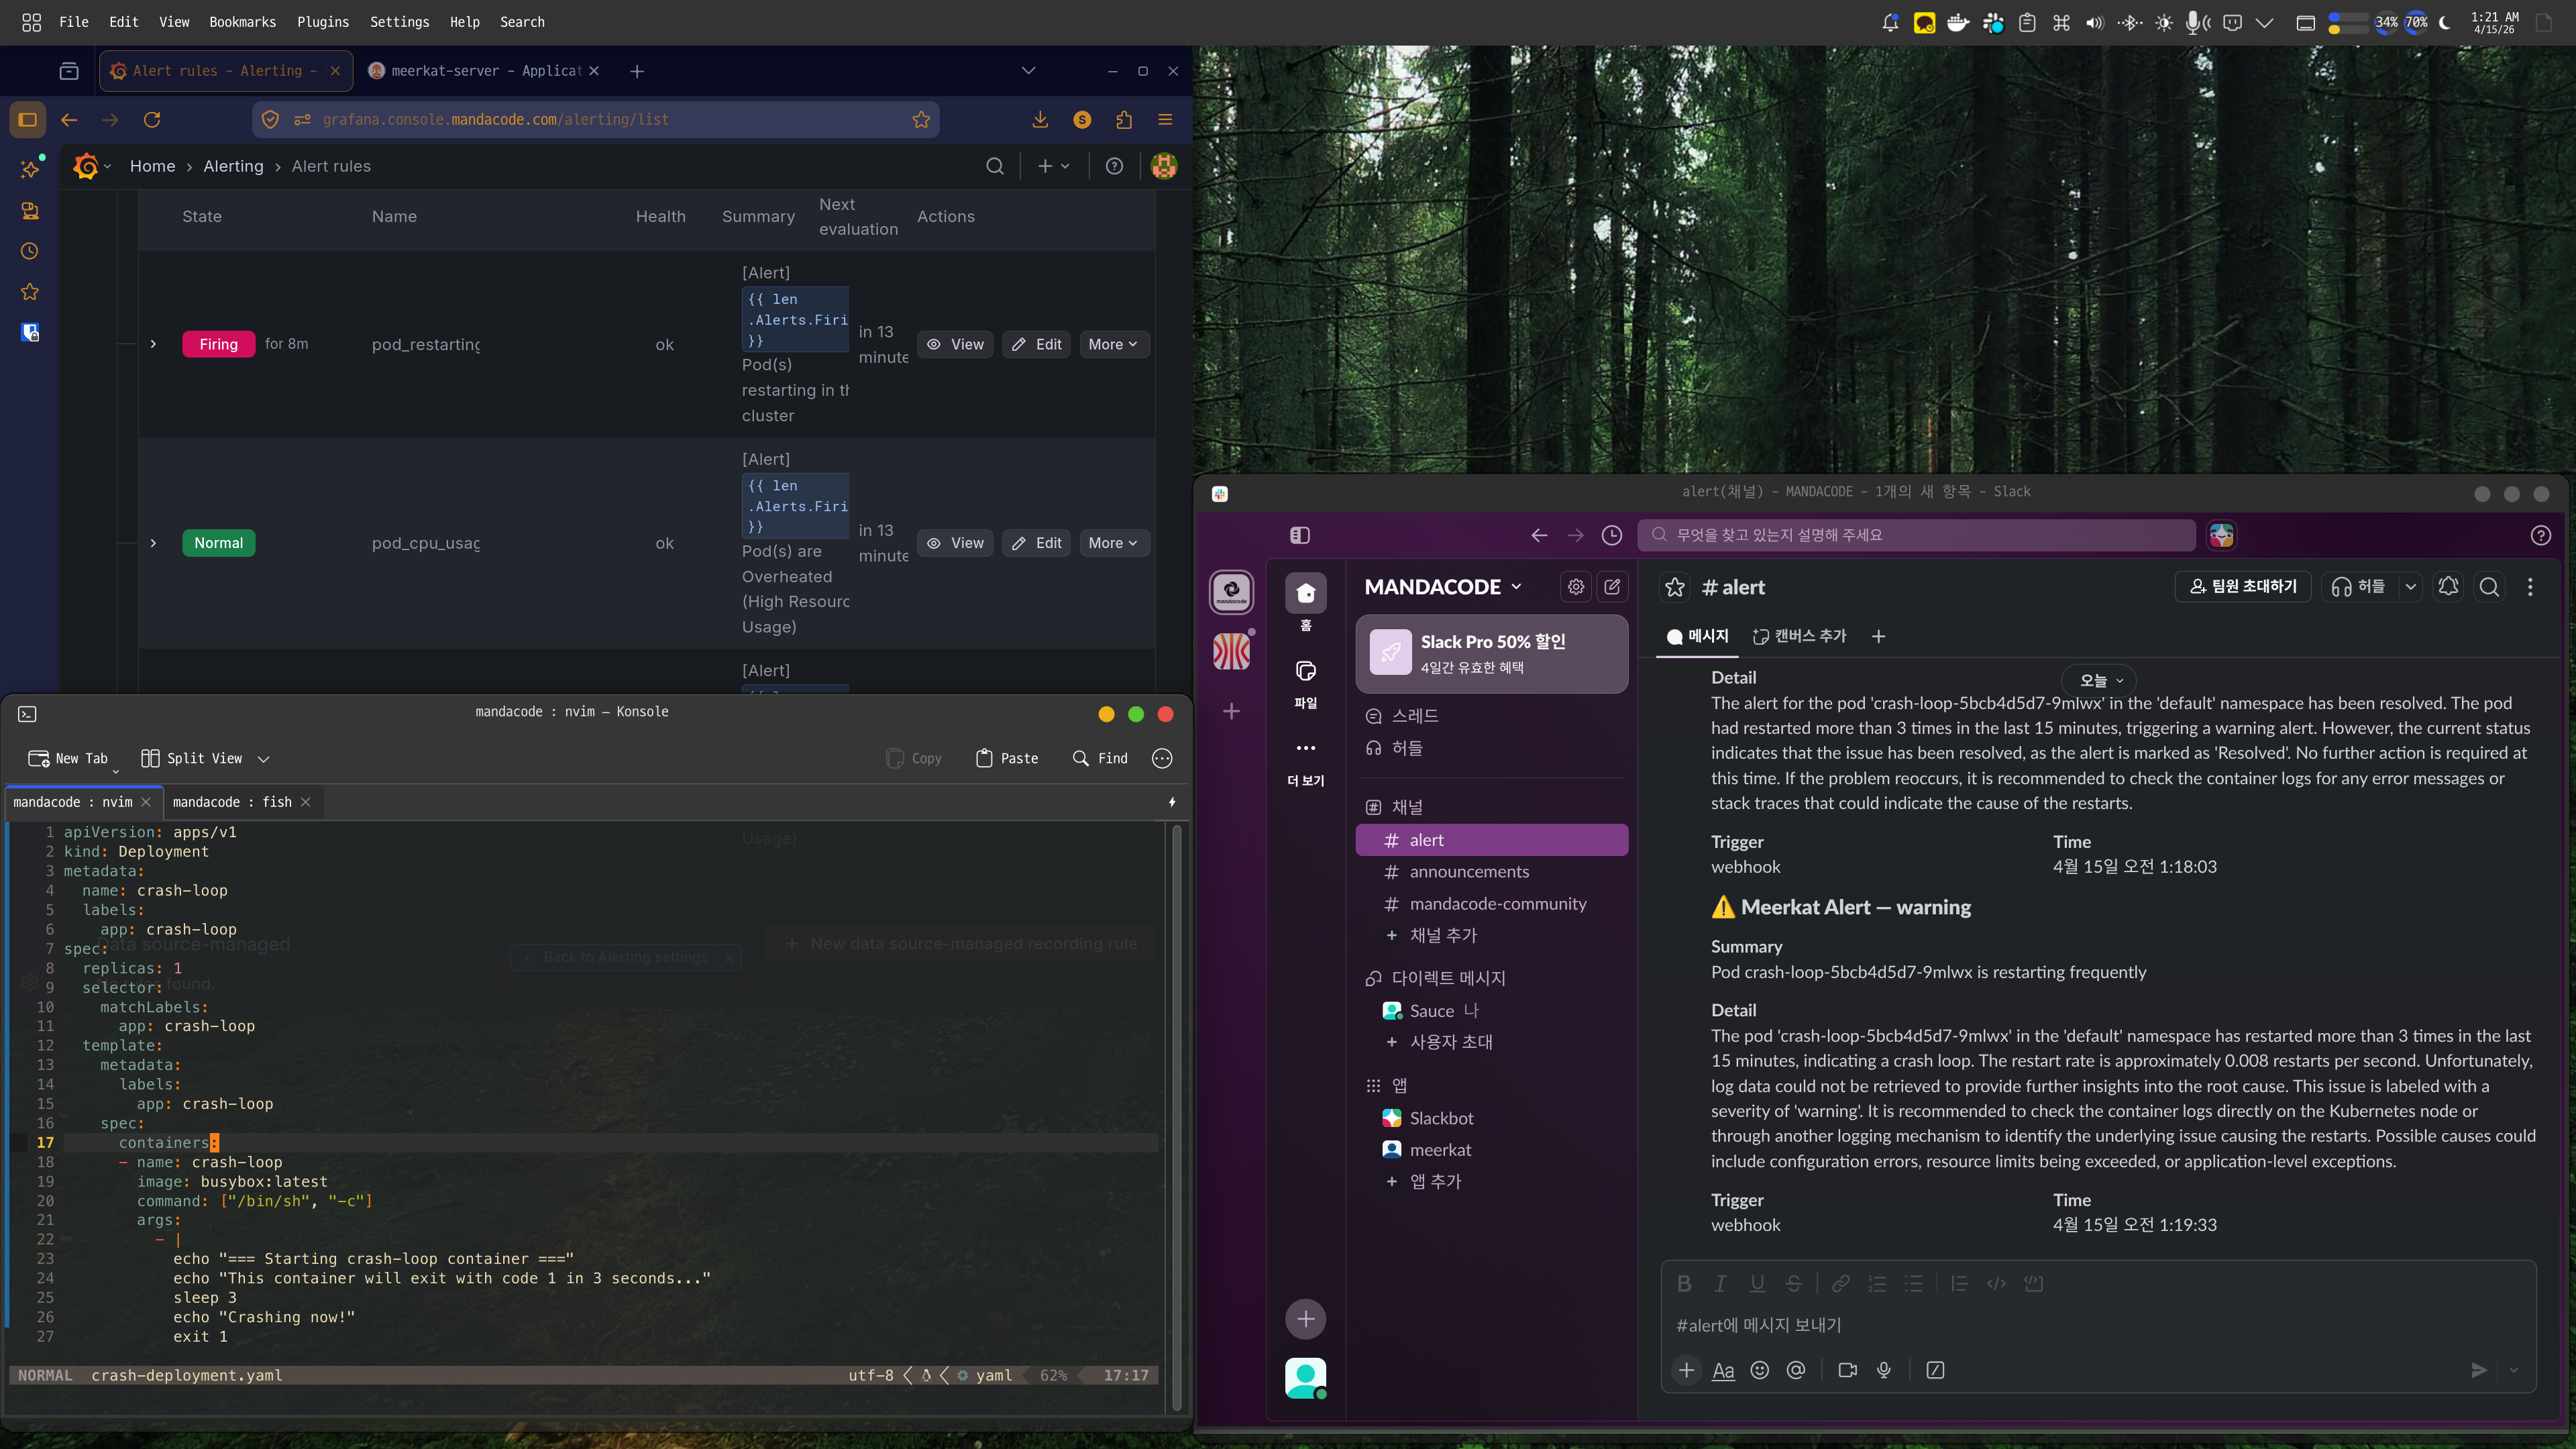
While operating clusters, I frequently encountered errors and often had to check the logs to find the cause, or the errors went undetected entirely. Also, managing clusters while trying to develop led to reduced time efficiency.
The Meerkat project was initiated to solve this problem. We believed that with an AI Agent that intelligently analyzes and perfectly organizes logs without needing to search manually, the cost of operating clusters could be reduced.
Core Design 1: RAG-Based Log Vector Storage
Meerkat is comprised of two services: Analyzer and Vectors.
The Analyzer aggregates data to analyze error causes, while Vectors store logs transmitted via OpenTelemetry as meaningful data.
Vectors do not simply store logs. They deduplicate logs received from OpenTelemetry through template extraction, convert them into vectors using an embedding model, and store them in a vector database like Milvus. This prevents duplicate error logs from the same service and significantly improves search efficiency using the vectorized data.
graph LR
    subgraph "Data Flow"
        App[Application] -- OTLP Logs --> Vectors
        Vectors -- Embedding Store --> Milvus[(Milvus)]
        Analyzer -- Semantic Search --> Vectors
    end
Core Design 2: Tool-Based Metrics/Logs Analysis
To autonomously analyze error causes, the Analyzer uses the concept of tools, akin to coding agents like OpenCode/Claude. An interface was developed to communicate with external dependencies like Vectors, Prometheus, enabling dynamic cause investigation within a loop.
sequenceDiagram
    participant User as User
    participant Analyzer as Analyzer
    participant LLM as LLM
    participant Tools as Tools

    User->>Analyzer: Analysis Request
    Analyzer->>LLM: Context + List of Available Tools

    loop Agent Loop
        LLM-->>Analyzer: Tool Call or Final Answer

        alt Tool Call
            Analyzer->>Tools: Query Prometheus/Loki/Vectors
            Tools-->>Analyzer: Result
        else Final Answer
            Analyzer-->>User: Analysis Complete
        end
    end
Considerations in the Operating Environment
Due to the nature of the system, the Analyzer can receive many requests in a short period due to errors and repeated errors coming from each application. Processing them synchronously on a single server can lead to throughput reduction and issues such as timeouts.
This was addressed by adopting a worker pool. It increases processing efficiency through parallel processing and prevents the critical issue of all goroutines waiting for LLM responses. In terms of scalability, even if multiple Analyzers are deployed, the worker pool regulates processing at the service front end, allowing natural expansion.
Scope for Improvement
In creating Meerkat, efforts were made to maintain the characteristics of a log monitoring service while creating a loose coupling with external infrastructure services. Nonetheless, varying responsibilities, protocols, and request/response schemas between OpenTelemetry, Prometheus, Loki, ELK, etc., present challenges for application in different environments. Therefore, future updates for diverse specifications are needed, with the goal of applicability across various infrastructural services and environments.
Additionally, there are cases where the syntax required for log or metric searches is different or complex for the respective services. It is considered important to create a clearer structure for the tools so that agents can easily understand the system.
Conclusion
This project, which was conducted while considering various external services, is still in an unstable state. However, by developing and operating the Meerkat service, infrastructure operation efficiency was dramatically improved. We solved the process of analyzing logs and identifying causes, confirming the potential for an AI Agent-based infrastructure operation system.